What is Phylogenetics?
Phylogenetics is the study of evolutionary relationships among organisms. Historically, phylogenetics studied organism morphology, however with advances in sequencing, modern day phylogenetics relies on DNA and protein sequences.
How do we read a phylogenetic tree?
|
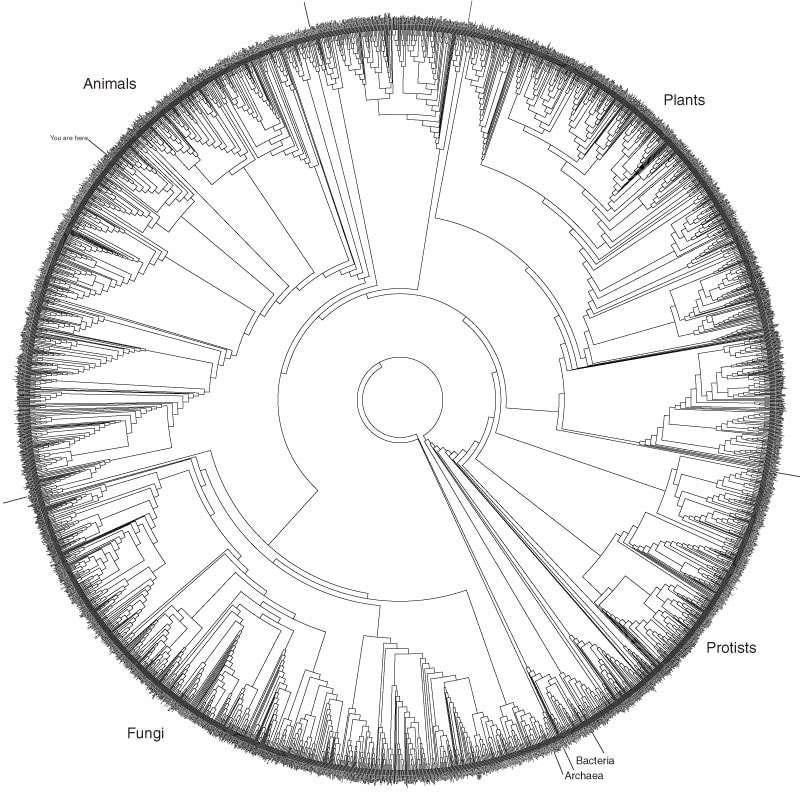
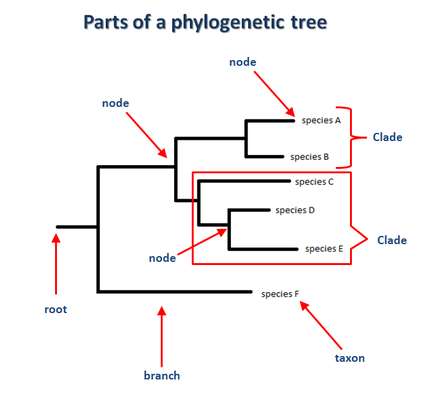
A phylogenetic tree consists of three main areas: the nodes, the branches, and the species. On a phylogenetic tree, nodes represent the most recent common ancestor between two taxa. From the node, a branch connects the node to a species of interest. Species can be grouped into clades based on a shared common ancestor between them (fig. 1a). Phylogenetic trees have the ability to carry massive computational information, and evolutionary relationships can be compared among hundreds of "factors" whether that be a species or the nucleotide sequence of a gene. Phylogeny is an extremely powerful tool used to study interspecies evolution, as well as entire domain evolution. Phylogenetics is even powerful to construct the Tree of Life (fig. 2a).
|
|
What can phylogeny tell us?
-What is the relationship and evolutionary history of a species, of organisms, of proteins, and/or of genes?
-How do these factors evolve?
-Can the evolution of these factors be better described with a mathematical model?
By looking at nucleotide and protein sequences, we are able to understand evolutionary history as well as infer an evolutionary future [6]. Using protein and nucleotide alignments [6], we are able to see where in a gene or protein evolution is more or less active.
Sequence alignment
Here are segments of the myotubularin-1 protein sequence used to construct the following phylogenetic trees.
Maximum Likelihood
Trees built using likelihood rely on probability. Likelihood is based on changes occurring to sequence of DNA or protein. This method of tree construction uses observed sequences and determines the probability of computer generated model could produce the observation. Under the likelihood model, a Markovian model of nucleic acid evolution is used [1]. This allows the likelihood for independent sites to be calculated to generate a total value of likelihood at the end. Trees are compared using all calculated topologies to generate the highest probability. The tree with the highest total probability has the highest maximum likelihood [2].
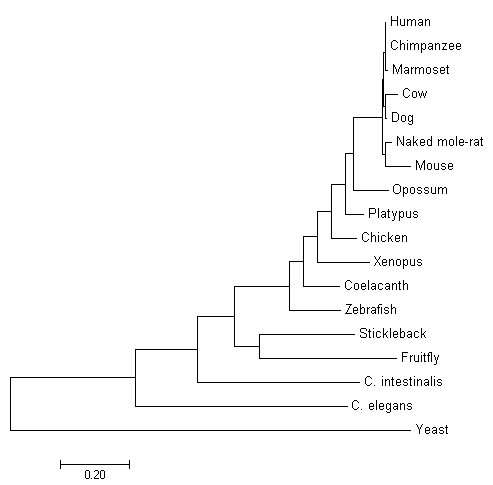
Fig. 1 Molecular Phylogenetic analysis by Maximum Likelihood Method
Maximum Parsimony
Maximum parsimony, also known as the minimum evolution method, attempts to minimize the number of steps required to reach the observed sequence variation. This method uses multiple sequence alignment. The most parsimonious tree is selected based on which tree requires the fewest evolutionary changes to produce the observed alignment are then chosen. This method can be problematic since sequence evolution is not considered [3].
The evolutionary history of myotubularin was inferred using the Maximum Parsimony method. Tree #1 out of 2 most parsimonious trees (length = 1021) is shown. The consistency index is 0.793340 (0.731893), the retention index is 0.550107 (0.550107), and the composite index is 0.436422 (0.402619) for all sites and parsimony-informative sites (in parentheses).
The evolutionary history of myotubularin was inferred using the Maximum Parsimony method. Tree #1 out of 2 most parsimonious trees (length = 1021) is shown. The consistency index is 0.793340 (0.731893), the retention index is 0.550107 (0.550107), and the composite index is 0.436422 (0.402619) for all sites and parsimony-informative sites (in parentheses).
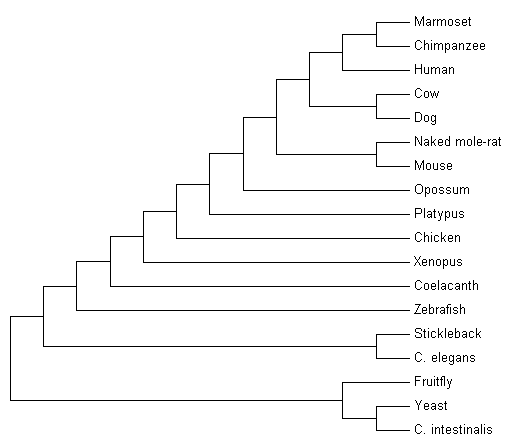
Fig. 2 Tree #1 or 2 used by Maximum Parsimony method
Neighbor-Joining
Neighbor-joining relies on on finding pairs of operational taxonomic units (OTUs). OTUs are used to minimize branch length as well as obtain parsimony [4]. This method does not require all lineages to have diverged the same amount, therefore making this method suited for lineages with different rates of evolution. Using this allows for correction of multiple substitutions [5]. The evolutionary history of this tree was inferred using the Neighbor-Joining method [1]. The optimal tree with the sum of branch length = 3.48183372 is shown. The tree is drawn to scale, with branch lengths in the same units as those of the evolutionary distances used to infer the phylogenetic tree. The evolutionary distances were computed using the Poisson correction method [2] and are in the units of the number of amino acid substitutions per site
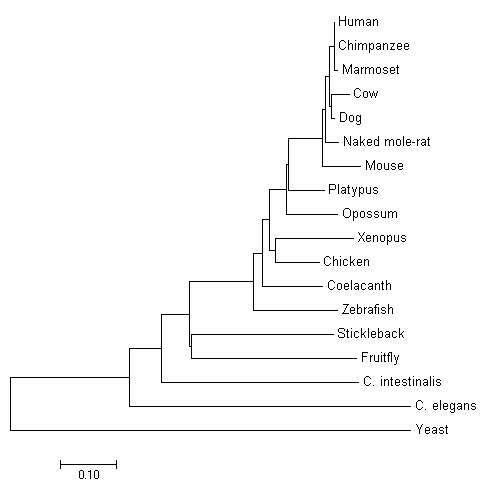
Fig. 3 Evolutionary relationships of taxa by Neighbor-joining method
References:
[1] https://hackernoon.com
[2] http://www.deduveinstitute.be/~opperd/private/max_likeli.html
[3] http://cshprotocols.cshlp.org
[4] Molecular Biology and Evolution, Volume 4, Issue 4, 1 July 1987, Pages 406–425,https://doi.org/10.1093/oxfordjournals.molbev.a040454
Published:01 July 1987
[5] http://www.deduveinstitute.be/~opperd/private/neighbor.html
[6] Modeling nucleotide sequence evolution, College of Computer, Mathematical and Natural Sciences.
